Svetlin Penkov
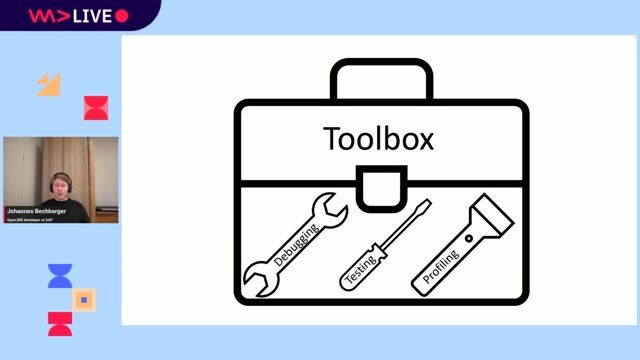
Debugging Machine Learning Code
#1about 6 minutes
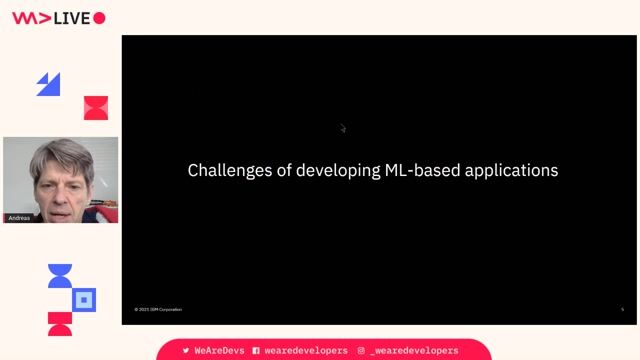
The core challenge of debugging machine learning code
Machine learning models are defined by complex computations on high-dimensional data, making traditional debugging methods ineffective.
#2about 4 minutes
Why you should verify code correctness before redesigning models
Poor model performance is often caused by simple code bugs rather than flawed model architecture, a common oversight in the R&D cycle.
#3about 4 minutes
Distinguishing between semantic and runtime bugs in development
The development process involves two distinct feedback loops for handling semantic bugs from model translation and runtime bugs from data issues.
#4about 9 minutes
Limitations of traditional debugging methods for ML
Standard techniques like printing variables, plotting, and custom dashboards fail to provide insight into the complex, high-dimensional state of modern ML models.
#5about 5 minutes
Introducing FMRI for interactive 3D data visualization
The FMRI debugger allows you to inspect high-dimensional tensors visually in 3D, making it easy to understand complex data structures with a single line of code.
#6about 8 minutes
Visualizing a CNN's computational graph with FMRI scan
By wrapping a training loop with the scan function, FMRI automatically generates an interactive 3D computational graph of a PyTorch model.
#7about 3 minutes
Scaling visual debugging and using automated assertions
FMRI handles large-scale models like VGG19 and includes a library of assertions to automatically detect common issues like vanishing gradients or invalid inputs.
#8about 6 minutes
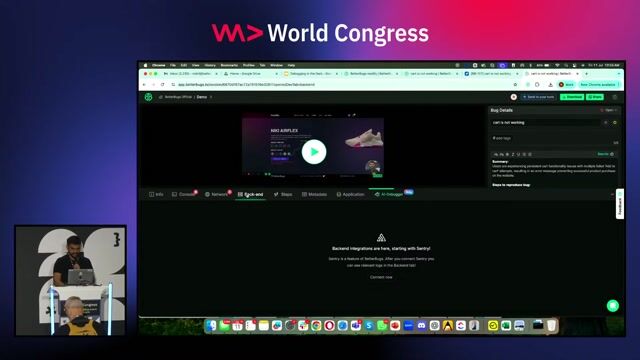
Live demo of debugging a CNN with FMRI assertions
A live demonstration shows how to inspect a 3D tensor and use FMRI's built-in assertions to instantly find the root cause of NaN errors in a CNN.
#9about 3 minutes
Exploring the full computational graph of ResNet-101
This demonstration visualizes the entire ResNet-101 model, showcasing the tool's ability to handle massive computational graphs and explore learned features.
Related jobs
Jobs that call for the skills explored in this talk.
Matching moments
14:46 MIN
Key takeaways and Q&A on debugger internals
Debugging Unveiled: Exploring Debugger Internals and Hidden Gems
Unlock full access
Log in or set up an account to access this feature and more.
01:39 MIN
Using LLMs to understand and navigate codebases
How E.On productionizes its AI model & Implementation of Secure Generative AI.
Unlock full access
Log in or set up an account to access this feature and more.

05:25 MIN
Modern developer tools and debugging workflows
WeAreDevelopers LIVE - Whats Nuxt and Next for app development, 20 years AJAX and more
Unlock full access
Log in or set up an account to access this feature and more.
03:01 MIN
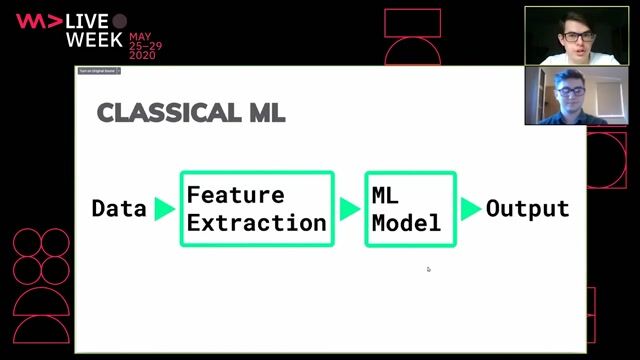
Common challenges in developing machine learning applications
Data Fabric in Action - How to enhance a Stock Trading App with ML and Data Virtualization
Unlock full access
Log in or set up an account to access this feature and more.
01:47 MIN
Using AI for root cause analysis and fixes
Debugging in the Dark
Unlock full access
Log in or set up an account to access this feature and more.
05:56 MIN
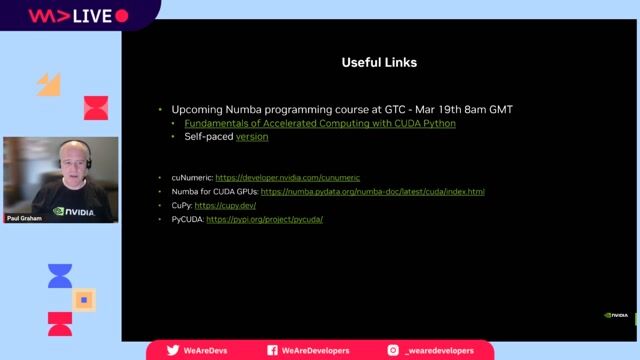
Developer tools and learning resources for GPUs
Accelerating Python on GPUs
Unlock full access
Log in or set up an account to access this feature and more.

02:28 MIN
Why coding fundamentals still matter in the age of AI
aa
Unlock full access
Log in or set up an account to access this feature and more.
03:27 MIN
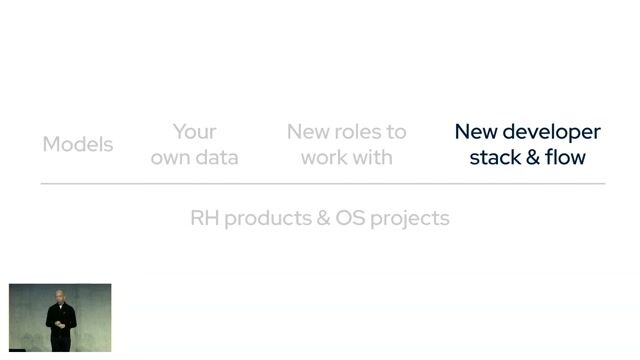
Understanding the new AI developer stack and MLOps workflow
Developer Experience, Platform Engineering and AI powered Apps
Unlock full access
Log in or set up an account to access this feature and more.
Featured Partners
Related Videos
 44:11
44:11Getting Started with Machine Learning
Alexandra Waldherr
 32:54
32:54The pitfalls of Deep Learning - When Neural Networks are not the solution
Adrian Spataru & Bohdan Andrusyak
 57:46
57:46Overview of Machine Learning in Python
Adrian Schmitt
 49:45
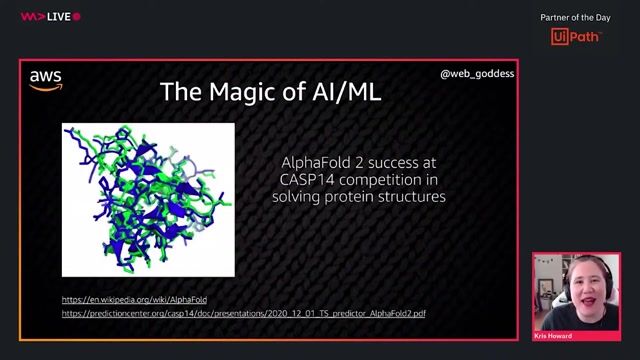
49:45Machine Learning for Software Developers (and Knitters)
Kris Howard
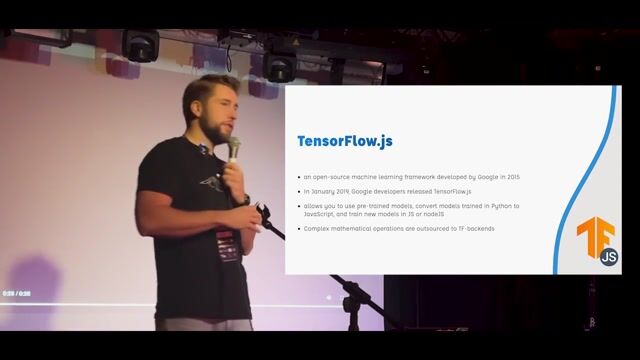
 38:24
38:24Machine learning in the browser with TensorFlowjs
Håkan Silfvernagel
 27:23
27:23From ML to LLM: On-device AI in the Browser
Nico Martin
 46:30
46:3030 Golden Rules of Deep Learning Performance
Anirudh Koul
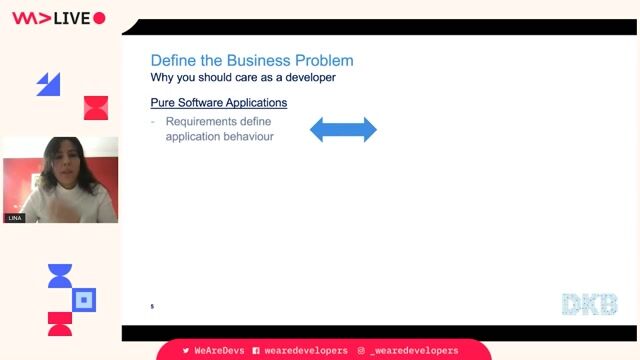 48:07
48:07Is my AI alive but brain-dead? How monitoring can tell you if your machine learning stack is still performing
Lina Weichbrodt
Related Articles
View all articles


From learning to earning
Jobs that call for the skills explored in this talk.


Nomitri
Berlin, Germany
DevOps
Gitlab
Docker
Ansible
Grafana
+6
Neural Concept
Lausanne, Switzerland
DevOps
Continuous Integration
score4more GmbH
Berlin, Germany
Remote
Intermediate
DevOps
TypeScript
Data analysis
Machine Learning
+2
Iq Plus
Schmiedrued, Switzerland
Intermediate
DevOps
Machine Learning