Stijn Polfliet
5 steps for running a Kubernetes environment at scale
#1about 3 minutes
Understanding the challenges of scaling Kubernetes with confidence
Kubernetes offers flexibility and efficiency but its dynamic nature can be complex to manage, requiring a structured approach to gain confidence.
#2about 3 minutes
Introducing a five-layer model for Kubernetes observability
An overview of the five essential layers for running Kubernetes with confidence, from cluster health to complete service observability.
#3about 5 minutes
Visualizing cluster health with the Kubernetes Cluster Explorer
A demonstration of how to use a visual tool to identify pod status, resource consumption, and troubleshoot issues like pending pods or crash loops.
#4about 7 minutes
Monitoring overall cluster health and resource consumption
Use kube-state-metrics and define resource requests and limits to manage cluster capacity and prevent pods from being killed due to memory issues.
#5about 2 minutes
Improving security and performance with small container images
Use purpose-built base images like Alpine instead of generic Linux distributions to reduce image size, improve build times, and minimize security vulnerabilities.
#6about 4 minutes
Tracking dynamic cluster behavior with events and health checks
Implement readiness and liveness probes to inform Kubernetes about pod health and use an observability platform to correlate events with performance issues.
#7about 3 minutes
Correlating log messages for faster troubleshooting
Use a lightweight forwarder like Fluent Bit to centralize logs and correlate them with cluster events and metrics for contextual debugging.
#8about 9 minutes
Using distributed tracing to map microservice communication
Implement distributed tracing to understand request flows, identify performance bottlenecks between services, and view in-process spans for code-level analysis.
#9about 11 minutes
Integrating Prometheus for complete service observability
Leverage the Prometheus ecosystem by forwarding metrics to a central platform using remote write or a direct scraper integration for unified dashboarding.
#10about 9 minutes
Getting started with the New Relic Kubernetes integration
A step-by-step guide on how to install the New Relic agent and its components in your cluster using a guided wizard and Helm charts.
Related jobs
Jobs that call for the skills explored in this talk.
Matching moments
03:18 MIN
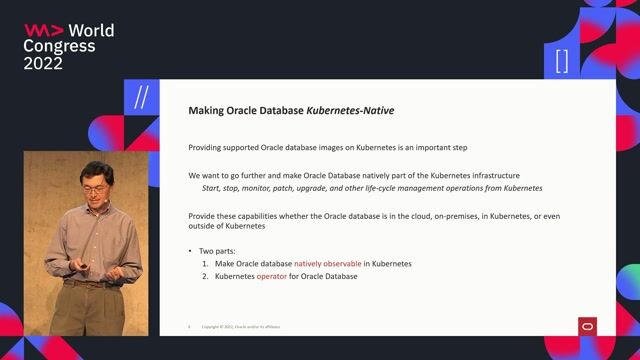
Achieving native database observability in Kubernetes
Kubernetes and Microservices with Multi-Model Databases
Unlock full access
Log in or set up an account to access this feature and more.

03:09 MIN
Common challenges when scaling self-hosted runners
A deep dive into ARC the Kubernetes operator to scale self-hosted runners
Unlock full access
Log in or set up an account to access this feature and more.
00:51 MIN
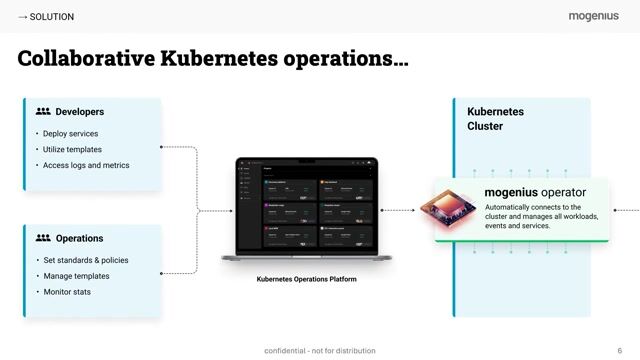
Integrating a Kubernetes abstraction layer into your stack
Startup Presentation: Achieving True Developer Self-Service in Kubernetes
Unlock full access
Log in or set up an account to access this feature and more.
01:52 MIN
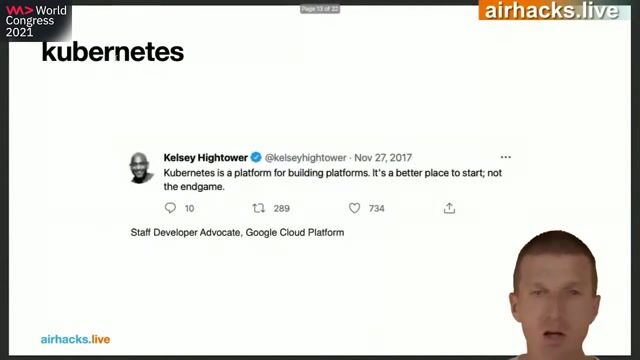
Understanding Kubernetes as a foundational platform
Effective Java Strategies and Architectures for Clouds
Unlock full access
Log in or set up an account to access this feature and more.
03:37 MIN
Addressing unique data protection challenges in Kubernetes
It's all about the Data
Unlock full access
Log in or set up an account to access this feature and more.
03:01 MIN
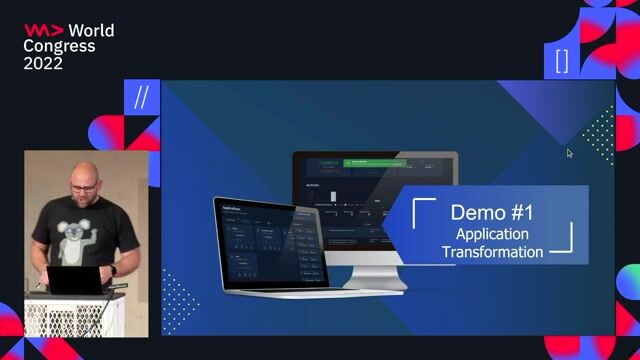
Tools and techniques for Kubernetes development
How I saved 200K/yr in direct costs writing 0 code lines in K8s
Unlock full access
Log in or set up an account to access this feature and more.
02:45 MIN
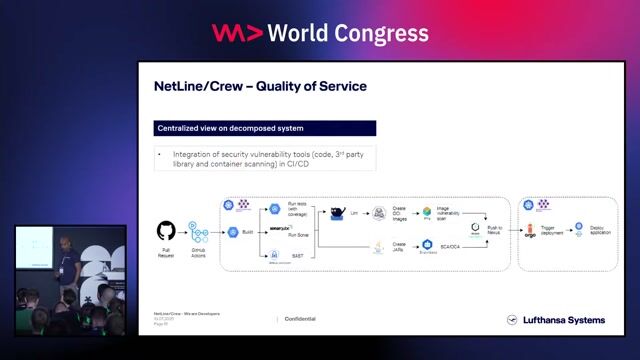
Maintaining quality with automation and observability
Crew Management System for Airlines: Plan duties for pilots & flight attendants worldwide
Unlock full access
Log in or set up an account to access this feature and more.
02:26 MIN
Why teams move from monoliths to Kubernetes
Get ready for operations by pull requests
Unlock full access
Log in or set up an account to access this feature and more.
Featured Partners
Related Videos
 57:24
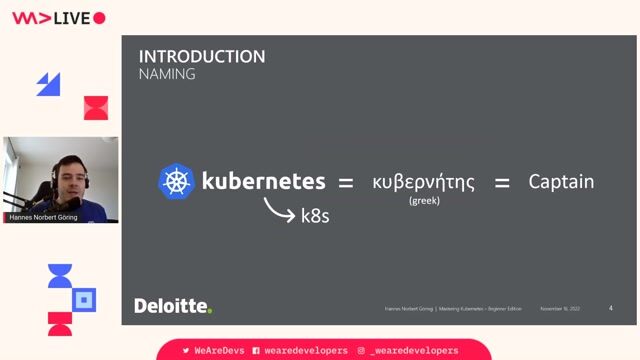
57:24Mastering Kubernetes – Beginner Edition
Hannes Norbert Göring
 40:00
40:00Local Development Techniques with Kubernetes
Rob Richardson
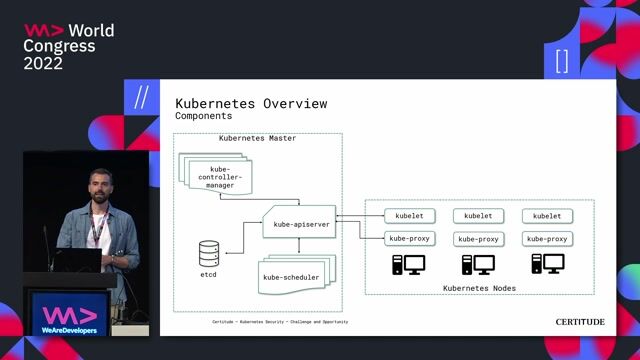 42:45
42:45Kubernetes Security - Challenge and Opportunity
Marc Nimmerrichter
 44:00
44:00Enhancing Workload Security in Kubernetes
Dimitrij Klesev & Andreas Zeissner
 45:49
45:49Databases on Kubernetes: Why you should care
Denis Wilson Souza Rosa & Steffen Schneider
 46:36
46:36Hacking Kubernetes: Live Demo Marathon
Andrew Martin
 48:45
48:45Databases on Kubernetes
Denis Souza Rosa
 28:36
28:36What we Learned from Reading 100+ Kubernetes Post-Mortems
Noaa Barki
Related Articles
View all articles


From learning to earning
Jobs that call for the skills explored in this talk.

smartclip Europe GmbH
Hamburg, Germany
Intermediate
Senior
GIT
Linux
Python
Kubernetes
Mittwald CM Service GmbH & Co. KG
Espelkamp, Germany
Intermediate
Senior
Linux
Docker
DevOps
Kubernetes

Stolzberger GmbH
€60-100K
Linux
DevOps
Gitlab
Ansible
+4