Johanna Schmidt
Web-based Information Visualization
#1about 8 minutes
Why information visualization is essential for data analysis
Visualizing data is crucial because humans interpret images better than numbers, as demonstrated by Anscombe's Quartet where identical statistics hide vastly different datasets.
#2about 6 minutes
The process of mapping data to visual attributes
Data mapping is the core process of converting data attributes into visual representations like position, size, shape, and color to create effective charts.
#3about 4 minutes
A survey of visualization tools and libraries
An overview of the visualization landscape covers fully-featured applications like Tableau and Power BI, as well as programming libraries for Python, R, and JavaScript.
#4about 6 minutes
Using SVG and Canvas for web visualizations
Web-based visualizations are primarily built using SVG for its vector graphics and native interactivity, while Canvas offers more complex drawing capabilities with WebGL.
#5about 4 minutes
A closer look at the D3.js library
D3.js is a powerful and flexible open-source JavaScript library that binds data to DOM elements, enabling a wide range of custom and interactive visualizations.
#6about 10 minutes
Choosing tools for analysis versus presentation
Data visualization serves different use cases like exploration and presentation, and a comparative study shows how tools like D3.js excel at flexible presentation.
#7about 5 minutes
Overcoming challenges of data size and security
Web-based visualizations must address performance issues with large datasets through aggregation and sampling, and handle the security implications of client-side data transfer.
#8about 1 minute
Key takeaways for effective web-based visualization
To succeed with web-based visualization, it is crucial to know your users and use case, carefully select the data to be shown, and leverage open-source libraries.
Related jobs
Jobs that call for the skills explored in this talk.
Matching moments
04:19 MIN
The theoretical foundations of modern data visualization
Python Data Visualization @ Deepnote (w/ PyViz overview)
Unlock full access
Log in or set up an account to access this feature and more.
03:01 MIN
An overview of the 2021 web developer survey
Web development best practices in 2021
Unlock full access
Log in or set up an account to access this feature and more.

01:57 MIN
Presenting live web scraping demos at a developer conference
Tech with Tim at WeAreDevelopers World Congress 2024
Unlock full access
Log in or set up an account to access this feature and more.

05:07 MIN
The World Wide Web era of scalability and design
Closing Keynote by Joel Spolsky
Unlock full access
Log in or set up an account to access this feature and more.
08:03 MIN
Exploring modern tools for web interaction and analysis
WeAreDevelopers LIVE - the weekly developer show with Chris Heilmann and Daniel Cranney
Unlock full access
Log in or set up an account to access this feature and more.
04:08 MIN
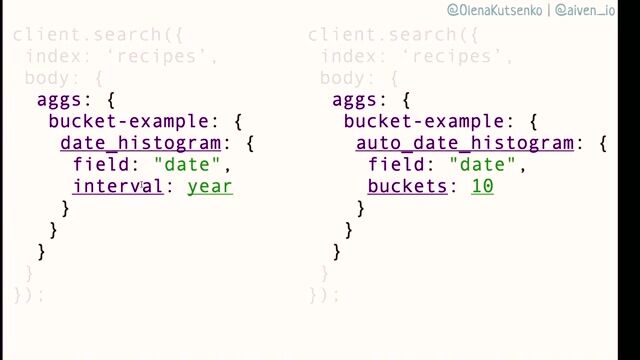
Visualizing data with OpenSearch Dashboards
Search and aggregations made easy with OpenSearch and NodeJS
Unlock full access
Log in or set up an account to access this feature and more.
05:36 MIN
The convergence of AI and business intelligence tools
Python Data Visualization @ Deepnote (w/ PyViz overview)
Unlock full access
Log in or set up an account to access this feature and more.
04:52 MIN
Interactive tools for learning CSS and visualizing data
New Browser APIs, End of React Create App, Smuggling Data in Emoji and more with Rowdy Rabouw
Unlock full access
Log in or set up an account to access this feature and more.
Featured Partners
Related Videos
 50:38
50:38Python Data Visualization @ Deepnote (w/ PyViz overview)
Radovan Kavický
 43:20
43:20The Art and Craft of Type Development
Michael Hladky & Stefan Baumgartner
 51:10
51:10Web development best practices in 2021
Laurie Voss
 34:34
34:34Vision for Websites: Training Your Frontend to See
Daniel Madalitso Phiri
 40:19
40:19React and the power of visualisation
Daisy Muyldermans
 1:00:19
Cyber Sleuth: Finding Hidden Connections in Cyber Data
Jennifer Reif
 43:11
43:11The State Of The Web
Jeremy Keith
 14:44
14:44Catching up on the basics you don't really need that much code
Chris Heilmann
Related Articles
View all articles
.gif?w=240&auto=compress,format)


From learning to earning
Jobs that call for the skills explored in this talk.

Ivy Partners
Maximum Personalmanagement GmbH
€60-75K
PostgreSQL
Microsoft Office
Microsoft SQL Server
Tech Solutions Gmbh
GIT
HTML
Vue.js