Gabriel Labachelerie
Monitoring as Code - Managing your dashboards at scale
#1about 2 minutes
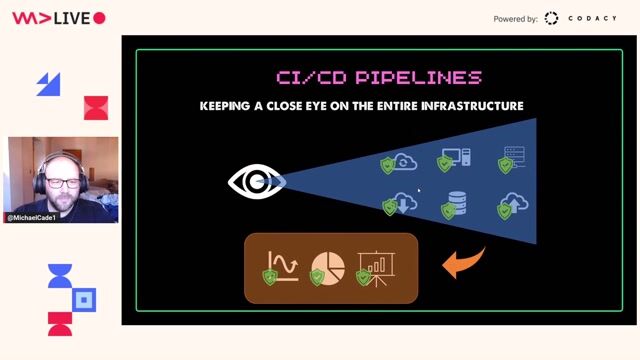
The challenge of monitoring at a global scale
Amadeus's large-scale production environment, with billions of daily transactions, requires a robust and scalable monitoring solution for its 24/7 frontline services.
#2about 2 minutes
Adopting an "as code" approach for dashboards
The observability stack uses Prometheus, Thanos, and Grafana, but manual dashboard creation was replaced with an industrialized "as code" approach to ensure quality and maintainability.
#3about 5 minutes
Building dashboards programmatically with Jsonnet
The solution uses Jsonnet to define dashboards as code, managed in Git and processed by a custom CLI tool for local development and deployment.
#4about 3 minutes
Creating reusable panel templates for metrics
A live coding demo shows how to create a reusable panel template in Jsonnet by defining a metric, available labels, and a base PromQL query.
#5about 6 minutes
Customizing panels with filters and dynamic variables
The framework allows for advanced customization by applying filters, changing layouts, and replacing hardcoded values with dynamic Grafana template variables for user selection.
#6about 2 minutes
Using loops to generate thousands of dashboards
Jsonnet's programming capabilities enable the automatic generation of hundreds or thousands of dashboards from a single template, such as creating a unique dashboard for each customer.
#7about 2 minutes
Unit and integration testing for monitoring code
Dashboards are treated like production software with unit tests to validate structure and integration tests using promtool to verify PromQL query logic against simulated data.
#8about 4 minutes
Integrating monitoring into a CI/CD pipeline
The entire workflow is integrated into a Jenkins CI/CD pipeline, which provides automated builds, tests, and JSON diffs in pull requests for safe deployments.
#9about 5 minutes
Focusing on developer experience and future plans
Key success factors include a strong focus on developer experience with a dedicated CLI and IDE support, with plans to open-source the tooling.
Related jobs
Jobs that call for the skills explored in this talk.
Matching moments
01:30 MIN
Observability, monitoring, and data management essentials
#90DaysOfDevOps - The DevOps Learning Journey
Unlock full access
Log in or set up an account to access this feature and more.

02:57 MIN
The challenge of creating monitoring dashboards from scratch
Planet-Scale Dashboards
Unlock full access
Log in or set up an account to access this feature and more.

12:43 MIN
Q&A on the future of CI/CD and tooling
Plan CI/CD on the Enterprise level!
Unlock full access
Log in or set up an account to access this feature and more.
02:27 MIN
Using existing tools like Grafana for ML monitoring
Is my AI alive but brain-dead? How monitoring can tell you if your machine learning stack is still performing
Unlock full access
Log in or set up an account to access this feature and more.

12:50 MIN
Implementing observability with Prometheus and Grafana
Microservices: how to get started with Spring Boot and Kubernetes
Unlock full access
Log in or set up an account to access this feature and more.
01:40 MIN
How engineers handle production errors and monitoring
DevOps at Netflix
Unlock full access
Log in or set up an account to access this feature and more.
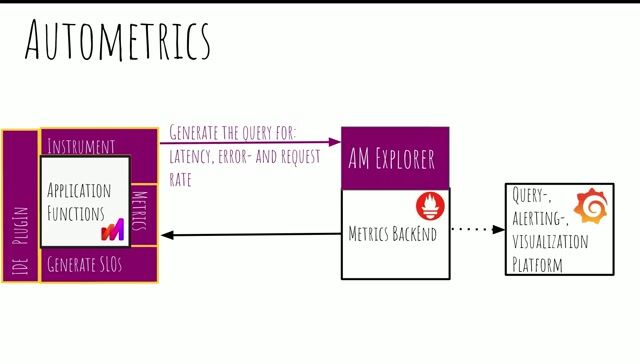
05:28 MIN
Demo of generating metrics and SLOs from code
Handling incidents collaboratively is like solving a rubix cube
Unlock full access
Log in or set up an account to access this feature and more.
03:52 MIN
Demo: Monitoring, backups, and data visualization
Protector Of The Realm
Unlock full access
Log in or set up an account to access this feature and more.
Featured Partners
Related Videos
 34:46
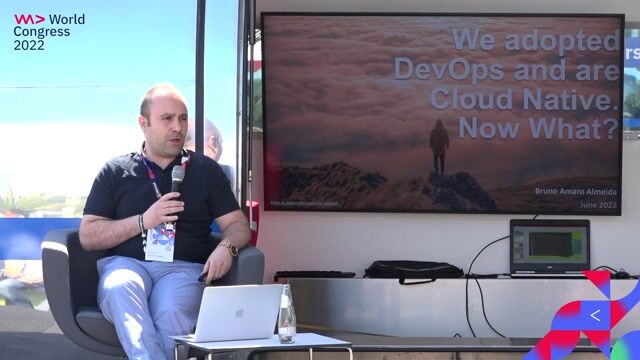
34:46We adopted DevOps and are Cloud-native, Now What?
Bruno Amaro Almeida
 41:06
41:06From Monolith Tinkering to Modern Software Development
Lars Gentsch
 17:31
17:31Our GitOps approach for deploying an Identity Provider and an API Gateway in a SaaS company
Axel Barbier
 56:19
56:19Plan CI/CD on the Enterprise level!
Pawel Piwosz
 31:48
31:48Monoskope: Developer Self-Service Across Clusters
Jan Steffen
 43:00
43:00Shipping Quality Software In Hostile Environments
Luka Kladaric
 36:09
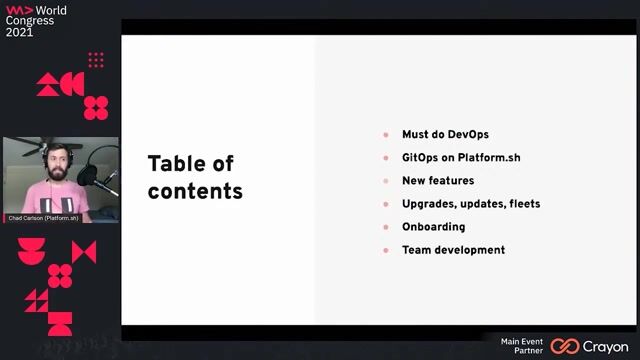
36:09GitOps keeps focus on apps, not on infrastructure
Chad Carlson
 43:47
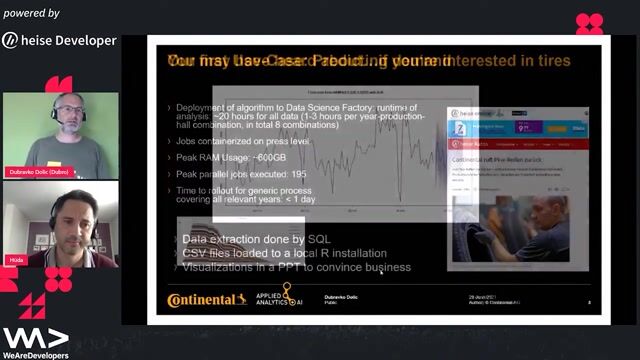
43:47Industrializing your Data Science capabilities
Dubravko Dolic & Hüdaverdi Cakir
Related Articles
View all articles


From learning to earning
Jobs that call for the skills explored in this talk.

Peter Park System GmbH
München, Germany
Senior
Python
Docker
Node.js
JavaScript
AUTO1 Group SE
Berlin, Germany
Intermediate
Senior
ELK
Terraform
Elasticsearch
