Shem Magnezi
The Journey of a Pixel in a React Application
#1about 6 minutes
Why understanding the rendering black box matters
Modern web development tools are easy to use, but understanding the underlying rendering process is crucial for debugging performance issues.
#2about 2 minutes
The initial step of DNS resolution
The browser's first action is to translate a human-readable domain name into a machine-readable IP address via DNS.
#3about 2 minutes
Fetching the initial HTML document from the server
After DNS resolution, the browser requests the root HTML file, which should be served quickly by minimizing server-side processing and using CDNs.
#4about 3 minutes
Parsing the HTML and its structure
The browser parses the received HTML, and performance can be improved by keeping the document minimal, clean, and strategically ordering elements.
#5about 3 minutes
Fetching CSS, JavaScript, and other page resources
The browser fetches linked resources like CSS and JavaScript in parallel, which can be optimized through compression and deferred loading of non-critical assets.
#6about 3 minutes
Executing JavaScript and optimizing the bundle
The browser executes the JavaScript bundle, and its size can be optimized using build system techniques like code splitting and tree shaking.
#7about 2 minutes
Understanding the React component lifecycle
React manages the component lifecycle, and following best practices for mounting, updating, and unmounting helps its engine perform optimizations efficiently.
#8about 2 minutes
How React uses the virtual DOM for updates
React's reconciliation process compares the virtual DOM to the real DOM, and performance can be improved by using stable keys and avoiding deep component nesting.
#9about 2 minutes
Fetching dynamic data and managing state
Applications fetch dynamic data from servers, which should be optimized by requesting only what's needed and using client-side caching to manage state updates.
#10about 2 minutes
Enabling user interaction and using debugging tools
Once rendering is complete, the application becomes interactive, and developers can use tools like Chrome DevTools and Lighthouse to analyze and debug the entire process.
Related jobs
Jobs that call for the skills explored in this talk.
Matching moments

01:18 MIN
Why developers and businesses choose to use React
React and the power of visualisation
Unlock full access
Log in or set up an account to access this feature and more.

06:13 MIN
Navigating the complexity of performance debugging tools
WeAreDevelopers LIVE - Rendering in the Browser, The State of CSS and Accessibility and more
Unlock full access
Log in or set up an account to access this feature and more.
02:23 MIN
Understanding client-side rendering and its trade-offs
What the Heck is Edge Computing Anyway?
Unlock full access
Log in or set up an account to access this feature and more.

10:57 MIN
Scaling collaboration and improving developer tooling
Rendering Design Software in the Browser at Penpot
Unlock full access
Log in or set up an account to access this feature and more.

03:55 MIN
An overview of Next.js and its optimization capabilities
Next.js Unleashed: Optimizing Web Vitals for superior User Experience
Unlock full access
Log in or set up an account to access this feature and more.
03:15 MIN
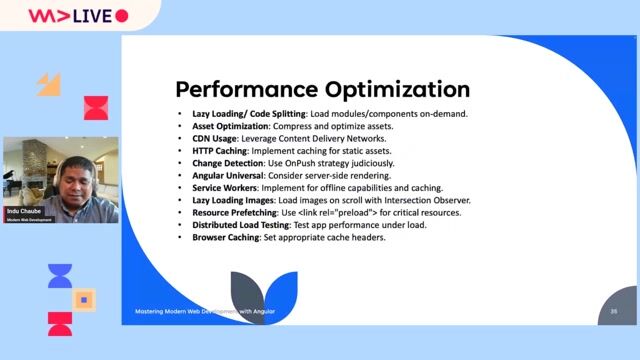
Applying key performance optimization techniques
Angular Unleashed: Mastering Modern Web Development with Angular
Unlock full access
Log in or set up an account to access this feature and more.

02:53 MIN
Why in-depth React knowledge may not be a good investment
Keith Cirkle of GitHub on React Fatigue
Unlock full access
Log in or set up an account to access this feature and more.
05:23 MIN
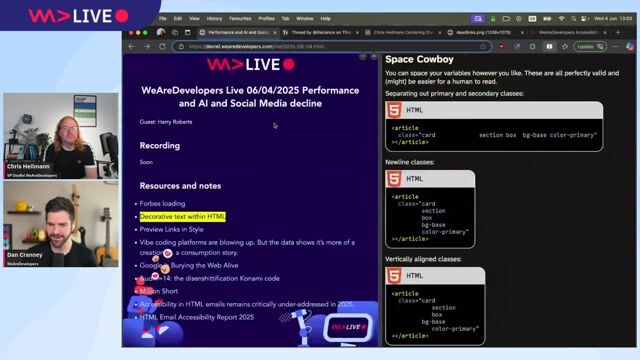
Separation of concerns versus modern web frameworks
WeAreDevelopers LIVE - Performance and AI?, Social Media decline, Developer Events and more
Unlock full access
Log in or set up an account to access this feature and more.
Featured Partners
Related Videos
 43:08
43:08A journey of a long list in React
Adam Klein
 24:10
24:10Challenges of building React and React Native apps
Milica Aleksic & Stefan Nikolic
 26:44
26:44Next.js Unleashed: Optimizing Web Vitals for superior User Experience
Eileen Fürstenau
 14:44
14:44Catching up on the basics you don't really need that much code
Chris Heilmann
 46:46
46:46The Lean Web
Chris Ferdinandi
 21:35
21:35Build UIs that learn - Discover the powerful combination of UI and AI
Eliran Natan
 23:09
23:09Building Better Apps with React Native
Marc Rousavy
 28:56
28:56The Illusion of a Performant Web Application
Cathrin Möller
Related Articles
View all articles


From learning to earning
Jobs that call for the skills explored in this talk.

Die Socialisten
Vienna, Austria
Senior
Jest
React
Redux
JavaScript

Optimi Solutions GmbH
Remote
GIT
TypeScript
React Native
Continuous Integration
Tech Solutions Gmbh
GIT
HTML
Vue.js
Tech Solutions Gmbh
GIT
HTML
Vue.js
Tech Solutions Gmbh
GIT
HTML
Vue.js
Shyfter
Brussels, Belgium
Remote
Senior
Next.js
TypeScript
React Native
Mindpeak
Intermediate
Linux
WebGL
Docker
TypeScript
Machine Learning